
In this chapter, we are going to learn how to create a new project that will have the connection to our database (that we created in the previous chapter), then we will get to know and experience with Looker’s unique language for data: LookML!
Creating a Project
Before you start, make sure you have access to the database connection from chapter 1 and permission to develop LookML. Switch to Development mode before creating the model.
- Go to the Looker Homepage
- Press on Develop

- From there, Select Projects

- On the Models and Projects page, click New model to open Create a Model.

Select Database Connection
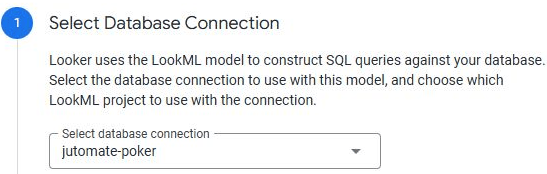
- Select the connection to the datasource that you’ve created during the previous chapter of this tutorial by looking up it’s name on the list.
 (opens in a new tab)
The screenshot uses an example connection. Select your own connection for this tutorial.
- Choose Or create a new LookML project for this model and enter a LookML Project Name. If no existing projects are listed for your connection, enter the new project name in the available field.
- Choose whether to generate a README, then click Next.
 (opens in a new tab)
Select Tables
- For a BigQuery connection, select the Google Cloud project that contains your dataset in Select GCP project. Use Search Project Name if needed.
- Select the dataset, then open its Tables tab and select the tables you want to include. Select all relevant tables if you want a view for each of them.
- Open a table’s Fields tab to review the fields to include. Click Next.
Select Primary Keys
Select a primary key for a table only if you know which field uniquely identifies its rows. This step is optional; you can leave the selections empty for this introductory example and click Next.
Select Explores to Create
Select the views you want to use as starting points for Explores, then click Next. The generator can infer joins from the primary keys selected in the previous step. Leaving those keys unselected keeps this example focused on the individual views.
Enter Model Name
Enter a unique model name, then click Complete and View Model to generate the files and open the Looker IDE.
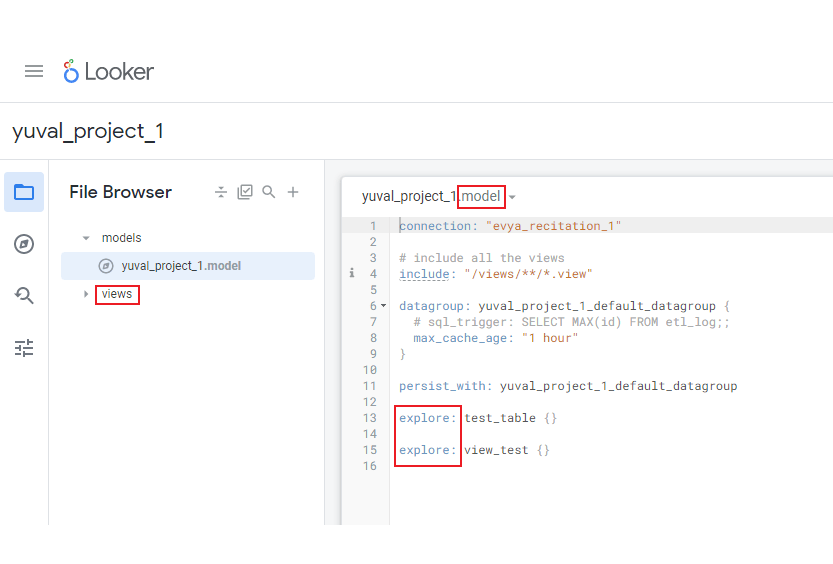
- You should now get a similar screen as the following:
 (opens in a new tab)
The generated files and table names depend on your selected database tables. The code screenshots below use the original test_table example.
- A model defines the database connection and the Explores available for querying. It is not a BigQuery dataset.
- A view defines fields and usually references a database table or a derived table.
- An Explore is a starting point for querying a base view and can include joined views. It is not itself a database table.
LookML
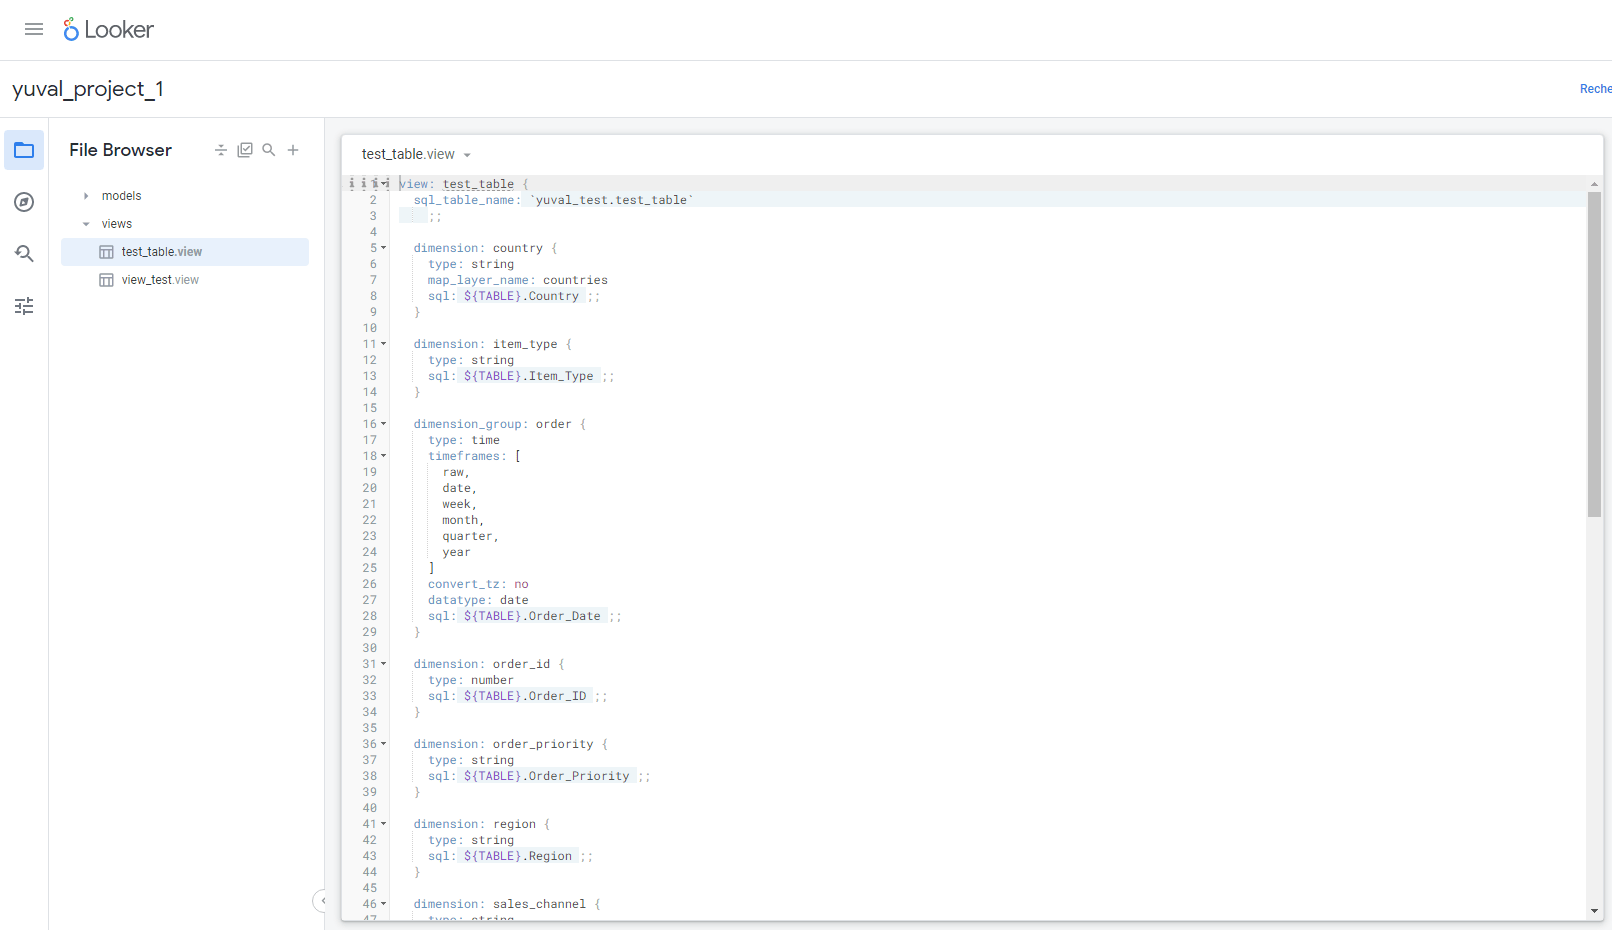
- Open a view file from the list under views (in this example “test_table”).

- Now you’ll see the LookML (Looker’s programming language for data) code of that view that Looker automatically created.
- Let’s get to know the foundations of it by going over the generated LookML code of our “test_table”.
 (opens in a new tab)
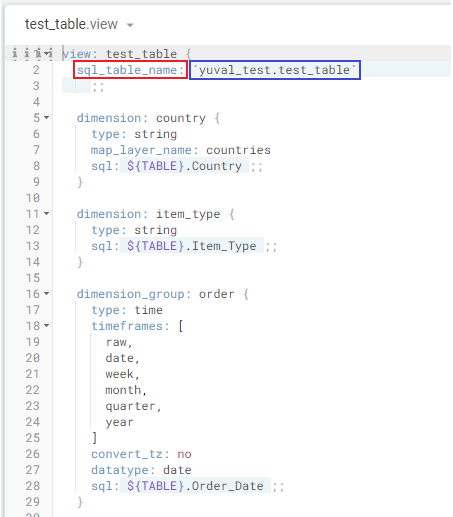
- Writing LookML requires declaring Parameters and assigning values to them.
 (opens in a new tab)
In this example the parameter is sql_table_name
and it dictates your table name
The value assigned to it is
yuval_test.test_table
so the view references the table called “test_table” from the dataset called “yuval_test”.
Dimensions are fields used to group and filter query results. A dimension can reference a database column or a SQL expression, and its nested parameters describe it:

In this example the dimension is named country and inside the following curly braces there are all the parameters that describe the dimension:
type: string means the data type of the field is string
map_layer_name: countries relates to a specific feature of Looker where it can map the countries and make a dashboard with them
sql: ${TABLE}.Country is a SQL statement that indicates which field we are referring to in our actual database table (Country in our case). ${TABLE} resolves to the SQL table alias for the current view; sql_table_name identifies the underlying table.
*Notice that each sql statement ends with a pair of semicolons.
Dimension groups and dates
Check which source column a dimension group references and the field names it generates before deciding whether to rename it.

In this example, order is a dimension_group that references the Order_Date column. Its timeframe dimensions include order_date, order_week and order_month, so the group does not need to be renamed just because its source column contains dates.

The alternative name order_date shown above is also valid, but it generates names such as order_date_date and order_date_month. If you choose to rename a group, update any LookML references to its generated fields.
- LookML has it own unique data types.
- Order_Date is a BigQuery DATE column in this example. Its dimension group uses type: time, while datatype: date identifies the underlying database type.

- The dimension_group for Order_Date creates a set of individual dimensions for different timeframes.
- The timeframes parameter specifies which timeframe dimensions to generate from the date value.

The dates can be expressed and queried by date, week, month, quarter or year. The raw timeframe is available for LookML references and does not appear in the Explore field picker.
*The convert_tz parameter set to no, means we want to prevent automatic time zone conversion of the data
- Another LookML data type is number which is used to represent numeric columns in a table.
- In this example the “order_id” column’s sql data type is Integer, so the dimension’s type in LookML is number.
 (opens in a new tab)
Measures
- Measures in LookML can represent aggregate functions like sums, counts, and averages that will be based on our table’s fields and columns. Some measure types perform non-aggregate calculations.
 (opens in a new tab)
*In here the measure was created defaultly by Looker.
We can add our own measures later on.
- Creating measures is very similar to creating dimensions.
- We state a measure parameter and define it by adding parameters that describe it, such as the type. For an average measure, sql identifies the expression to average; a type: count measure does not use sql.

In this example we created a measure named “avg_order”.
It’s type is average which means it calculates the average cost
The SQL statement indicates which field from the table we want to make the measure on, in our case “Total_Cost”
This averages Total_Cost across the underlying rows. It is not necessarily an average per distinct order if an order has more than one row.
- That’s it for this time.